The UK Driving Conditions Report
In the UK there are 40.7 million licenced vehicles on the road, increasing by 8.8% between 2021 and 2022. [1-2] With this steady rise of vehicles, comes the steady rise of traffic jams, collisions and speeding tickets across the country, making driving through city centres increasingly challenging.
Looking at commercial vehicle driving trends, we conducted an index study exploring where in the UK has the best and worst driving conditions, considering variables such as the frequency of collisions, frequency of bus and cycle lanes and average travel times. In response, we have provided internal expertise on how you can leverage this information to enhance the efficiency of your fleet routes and spoke to leading driving coaches to provide their top tips on traveling through a new city.
The UK cities with the best driving conditions
Our study involves the twenty-five most highly populated cities in the UK. Using a range of reputable online sources, we extracted data pertaining to each city center. These variables include average yearly collisions, average travel time per 10 km, the frequency of bus routes, cycle routes and speed cameras.
All results were standardised according to the square mile radius (mi2) of each city, to ensure that the outcomes accurately mirror the specific driving conditions and dynamics of each location.
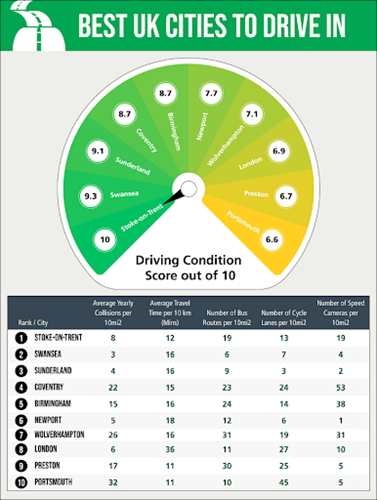
Stoke-on-Trent takes the lead as the UK city with the best driving conditions, achieving the highest possible score of ten on our index. Through displaying the third fastest travel time of just twelve minutes per 10 km, and being amongst the cities with the lowest frequency of bus routes (19 per 10 mi2) and cycle routes ( 13 per 10 mi2), Stoke-on-Trent provides a much less congested driving experience when compared to the majority of the UK. In addition, its low yearly average collision rate (8 per 10 mi2) further contributes to positioning Stoke-on-Trent as a preeminent choice for safe and smooth driving.
Swansea and Sunderland follow amongst the UK cities with the best driving conditions respectively scoring 9.3 and 9.1 on our index. Both cities have lower rates of collisions when compared to Stoke-on-Trent with 3 per 10 mi2 in Swansea and 4 per 10 mi2 in Sunderland. However, with a four minute higher travel time (16 minutes per 10 km), both missed out on the top spot.
Notably, London ranks as the eighth-best city in the UK to drive through, scoring 6.9 out of ten on the index. Despite having one of the highest travel times of thirty-six minutes per 10 km, the capital's low collision rate of 6 per 10 mi2 boosts this city into the top ten.
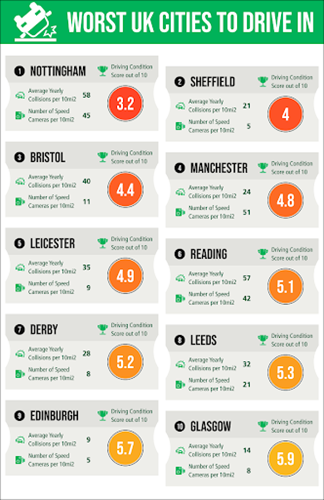
The UK cities with the worst driving conditions
Nottingham stands as the UK city with the worst driving conditions, scoring just 3.2 on our index. With a staggering 58 collisions per 10 mi2 each year, the highest across the board, this East Midlands city is arguably the most dangerous place in the UK to drive through. Alongside this, Nottingham has the highest frequency of bus routes (80 per 10 mi2) and road cycle routes (123 per 10 mi2) which, combined with an average travel time of twenty minutes per 10 km, also make this city one of the most congested.
Sheffield and Bristol also rank in the top three worst cities to drive through respectively scoring 4 and 4.4 on our index. Both cities rank considerably high for collisions and congestion, whilst low in speed safety cameras.
How to optimise your fleet routes on cross-country journeys
Optimising fleet routes for cross-country journeys isn't just about getting from point A to point B—it's about doing so with precision, economy, and effectiveness. By following the below steps you can reduce costs, and environmental impact, and increase the efficiency of your fleet.
Data Collection:
The first step before mapping out your cross-country strategy is to gather all relevant data about your fleet. This includes information on vehicle capacities, fuel efficiency, driver schedules, delivery points, and historical traffic patterns. A comprehensive understanding of your fleet's capabilities and constraints is essential for effective cross-country optimisation.
Define Your Priorities:
Clearly define your priorities, whether it's minimising travel time, reducing fuel consumption, or meeting strict delivery schedules. Tailoring your approach and routes to align with these priorities ensures that you're working towards specific objectives.
Consider Regional Restrictions:
Cross-country journeys often involve navigating a range of terrains and regulations. Take into account vehicle restrictions such as weight limits, height clearances, and hazardous material guidelines that may influence your route choices.
Load Optimisation & Aligned Driver Schedules:
Efficiency isn't just about your driver route but also about load distribution. Optimise how you distribute cargo among your vehicles to ensure that each truck is carrying the most efficient and balanced load.
Harmonise driver schedules with optimised routes to minimise delays and ensure that deliveries are made within specified time frames.
Top tips for driving in a new city
We spoke to driving coach Tracey Field, from Confident Drivers, to provide some advice for driving in a new city.
“Driving in a new city can be challenging and stressful, but some simple strategies can help you. Here are some tips to keep in mind:
- Local Regulations Research
A few of the common challenges you might face include navigating through unfamiliar streets and layouts, like multi-lane roundabouts equipped with traffic signals, one-way systems, designated red lanes for buses, or bus and cycle lanes with time restriction. It's crucial to be aware of specific urban challenges depending on the city, such as toll roads and ultra-low emission zones, in order to sidestep unforeseen penalties. If there is a part of your journey that you don’t feel comfortable with, add this to your planning and research.
- Route Planning
Drivers can overcome the above challenges with planning and giving yourself plenty of time for your journey to account for unexpected congestion or taking a wrong turn. If possible, plan to avoid rush hour traffic and don’t forget to plan any rest stops if it’s a longer journey.
Using a reliable GPS or map app is great for helping you recalculate your journey if you go off-course. Nonetheless, it's important not to solely depend on your GPS; maintaining vigilance in observing road signs and markings remains crucial for guiding your actions and timing. Make sure you know your destination and check out what3words to help you be more precise.
You can optimise your route by planning in advance, and on the day of your journey. Utilising a route planner to display the recommended path along with alternative routes equips you with additional knowledge about the area, reducing overreliance on your GPS or map application.
- Parking Planning
Plan your parking options close to your destination. Have a plan A and B if there are no spaces at your first choice. Alternatively, if circumstances permit, it's advisable to make parking reservations ahead of time to guarantee your spot.
Additionally, factor in the timing of your journey when considering parking options. The availability of parking spaces can vary depending on the time of day, traffic patterns, and local events. By taking into account the timing of your arrival, you can increase your chances of finding suitable parking while avoiding unnecessary stress.
Methodology
- Northgate Vehicle Hire conducted a study exploring which cities in the UK have the best and worst driving conditions
- A list of the 25 highest populated cities in the UK were extracted from World Population View
- The average yearly collisions for each city were scraped from Crash Map . To counteract the lack of data for 2022-23, internal experts collated annual crashes between 2017-2021 to calculate a yearly average. The lowest score from 1-25 was attributed to the city with the highest average crashes each year.
- The average travel time per 10 km for each city taken from Tom Tom. The UK average of eighteen minutes was applied to Newport, Southend-on-Sea, Derby and Plymouth due to no data appearing in the source. The lowest score was attributed to the city with the highest average travel time.
- The number of bus routes was taken from Geo Punk. The lowest score was attributed to the city with the highest number of bus routes.
- The number of road cycle routes were taken from Bike Map. The lowest score was attributed to the city with the highest number of cycle routes.
- The number of speed cameras in each city center was taken from SCDP. The lowest score was attributed to the city with the lowest number of speed cameras.
- All variables were standardised according to the square mile radius of each city.
- The scores for each variable were added together to establish a driving score out of 100 which was further simplified to a score out of 10.
- Cities were ranked in accordance with their driving conditions score.
Sources
[1] https://www.racfoundation.org/motoring-faqs/mobility#:~:text=A1)%20At%20the%20end%20of,the%20end%20of%20December%202020.